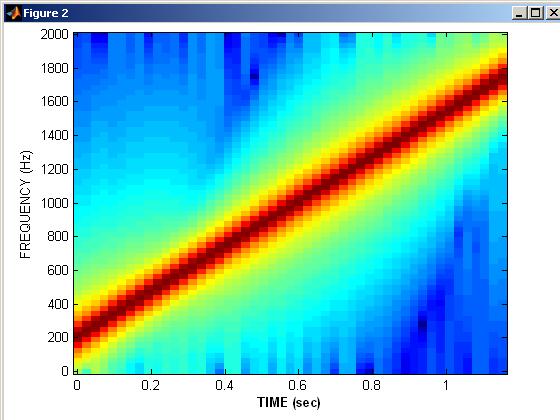
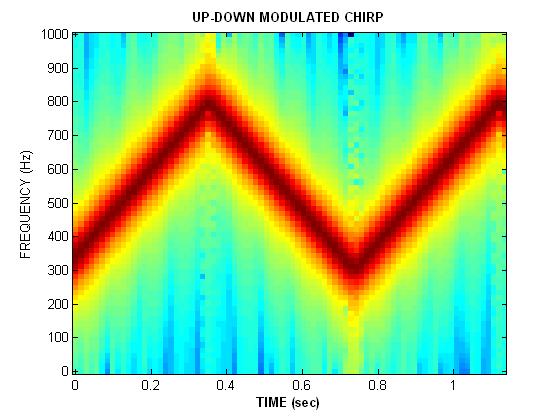
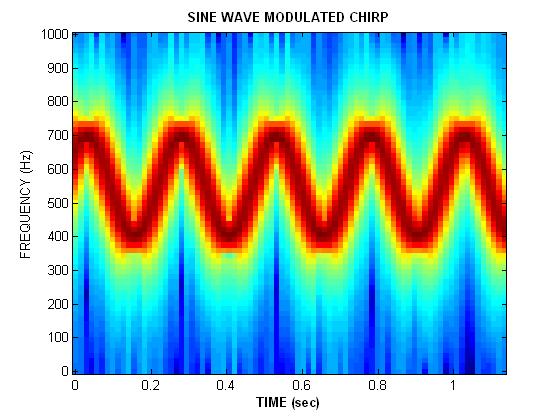
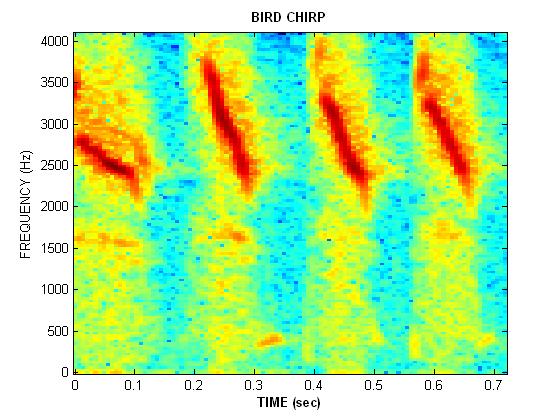
Listen to each of the signals again by clicking on the waveform.
The time signal for the LFM chirp can also be viewed by plotting LFM Chirp in the Time Domain
Can you point to features in the spectrograms that correspond to the changing tones (or pitch) in the sounds your hear?
Challenge: write the mathematical formula for the sine-wave modulated chirp. Use the concept of instantaneous frequency.
How would you model the bird songs with mathematically generated synthetic chirps?


