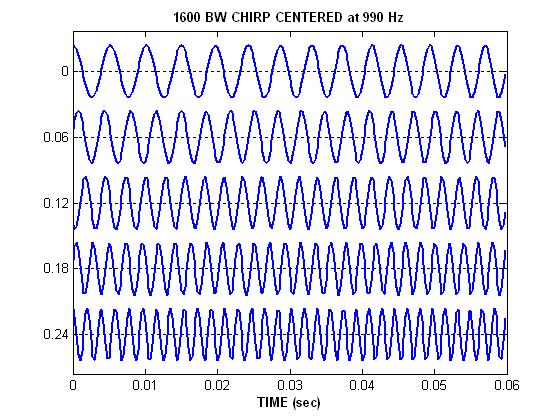
The time signal for a long LFM chirp is viewed by plotting the signal
along successive rows. Each row covers 60 milliseconds, so only the
first quarter of the signal is shown.
Notice how the period is getting shorter for later times.
Count the number of periods in two regions:
- for t between 0 and 10 milliseconds
(the beginning of the first row)
- for t between 240 and 250 milliseconds
(the beginning of the last row)
Estimate the frequency in these two regions by taking 1/Period. Did you get 200 Hz and 500 Hz?

Go back up to continue.
