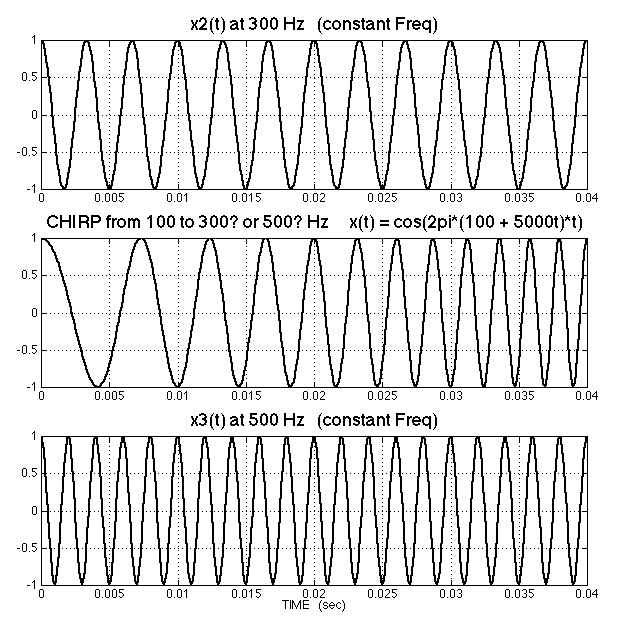
One way to understand the concept of instantaneous frequency is to compare
the plot of a LFM chirp side-by-side with the plot of a constant frequency
cosine wave. In the plot below the chirp is placed between a 300 Hz
sinusoid on top and a 500 Hz sinusoid on the bottom.
fi(t) = 10,000 t + 100 (Hertz)

Where do the frequencies line up ?
- the top plot seems to match near t = 20 milliseconds (0.02 secs).
- the bottom plot matches near t = 40 milliseconds (0.04 secs).
Thus we can conclude that the local instantaneous frequency rises linearly at a rate of 200 Hz per 20 milliseconds. As a result, the formula for instantaneous frequency versus time must be
