PythonFunctions, from your SVN repository. All your work for this assignment should be done within that project. Put your code in the appropriate *.py files given.
doctest module, introduced in Section 10.11 of the Python tutorial.)
-
add_quote(name, quote, date)to record that the named professor spoke the given bit of wackiness on the given date -
print_quotes(name)to print to the console a nicely formatted list of the quotes by the named professor, ordered by date
For this homework, your program does not need to save quotes to disk, but you do need to write some test code that uses the two functions.
Write a program, with unit tests, to recursively calculate a one-dimensional Haar wavelet transformation on an array of 2n numbers.
The one-dimensional Haar wavelet transformation converts its input from the time domain (where each number represents a sample of a signal over time) into the frequency domain. A two-dimensional version is used for image processing, but we'll stick with the one-dimensional version.
The Haar wavelet transformation has a couple of nice properties: it can be calculated very efficiently and the original signal can be completely recovered from the result.
The basic idea is to repeatedly calculate the average and a
change coefficient
for pairs of points. Suppose the array is
ar. The average of a pair of points is
(ar[i] + ar[i+1]) / 2, while the change coefficient is given by
(ar[i] - ar[i+1]) / 2.
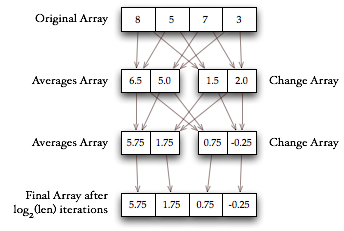
We apply this pairwise calculation to subsequent pairs of the original array to calculate 2n-1 averages and 2n-1 change coefficients, as shown in the figure below. We then make a new array where the first half consists of the averages of all pairs from the original array, and the second half consists of the change coefficients.
Then we do the same thing with the new array. After n iterations, the first element in the resulting array is the average of all the elements in the original array. Each successive element of the result represents the change coefficient at a lower frequency.
In general, for an array of length 2n, the process repeats n times. Or equivalently, for an array of length m, the process repeats log2(m) times.
Here are some example results:
-
haar([8,5])→[6.5] + [1.5] == [6.5, 1.5]Because
(8 + 5) / 2 == 6.5and(8 - 5) / 2 == 1.5. -
haar([5,8])→[6.5] + [-1.5] == [6.5, -1.5]Because
(8 + 5) / 2 == 6.5and(5 - 8) / 2 == -1.5. -
haar([8, 5, 7, 3])→[6.5, 5.0] + [1.5, 2.0] == [6.5, 5.0, 1.5, 2.0]
→[5.75, 1.75] + [0.75, -0.25] == [5.75, 1.75, 0.75, -0.25]The first step finds the average of 8 and 5 and of 7 and 3, giving the averages
[6.5, 5.0]. Similarly the first step gives the change coefficients[1.5, 2.0]. These two arrays are concatenated and the process is repeated to get to the final result. -
haar( [8, 7, 5, 3] )→ ... →[5.75, 0.75, 1.75, -0.25] -
haar( [0, 1, 2, 3, 4, 5, 6, 7] )→ ... →[3.5, -0.5, -1.0, 0.0, -2.0, 0.0, 0.0, 0.0]
How large an input can your implementation process? Here are some interesting inputs to experiment with:
-
[sin(pi*r/256) for r in range(0, 2048)] -
[sin(pi*r/256) + 0.25*cos(pi*r/64) for r in range(0, 2048)] -
[sin(pi*r**1.35/4096) for r in range(0, 2**12)]
It's fun to experiment with plotting the inputs and results. This isn't required, but here's some code that I used to do the plots:
def __test_haar(ar):
    result = haar(ar)
    maximum = max(ar + result)
    minimum = min(ar + result + [0])
    if len(ar) < 16:
        print("haar(", ar, ") =", result)
    win = GraphWin(str(ar), 500,300)
    win.setCoords(0, minimum, len(ar), maximum)
    Line(Point(0,0), Point(len(ar),0)).draw(win)
    p2, q2 = Point(0, ar[0]), Point(0, result[0])
    for i in range(1, len(ar)):
        p1, q1 = p2, q2
        p2, q2 = Point(i, ar[i]), Point(i, result[i])
        p_line, q_line = Line(p1, p2), Line(q1, q2)
        p_line.setOutline('red')
        p_line.draw(win)
        q_line.setOutline('blue')
        q_line.draw(win)
This problem was inspired by a blog post by Larry O'Brien. Ian Kaplan has a nice explanation and shows some interesting applications to stock market data.