| Table of Contents |
Crummett and Western Physics: Models and Applications,
Sec. 25.1-2
Halliday, Resnick, and Walker, Fundamentals of Physics (5th
ed.), Sec. 26-2,4
Tipler, Physics for Scientists and Engineers (3rd ed.), Sec.
21-1,5, 23-2
Some modern meters which measure capacitance do so by charging the capacitor for a known time (e.g. 1 sec.) with a known current and then measuring the voltage across the capacitor plates. They then calculate and display the capacitance using the definition of capacitance C = Q/V, where the charge Q is the current times the charging time. In this experiment, you will use a similar method to determine the capacitance of some unknown capacitors (and capacitor combinations), except that the capacitance to be measured is larger than that accommodated by most meters, and the charging time, therefore, longer.
In the last part of the experiment, another method is used to find an unknown capacitance. A capacitor which initially carries charge Q0 and has potential difference V0 across its plates, is discharged through a known resistor R. According to theory (see the references), both the capacitor charge Q and the voltage V will decay exponentially:
![]()
and
![]() (1)
(1)
as will, in consequence, the current through the resistor:

From equation (1)

so if one graphs ln(V) vs. t, the result should be a straight line of slope equal to (-1/RC). In this way, knowing R, we can calculate C.
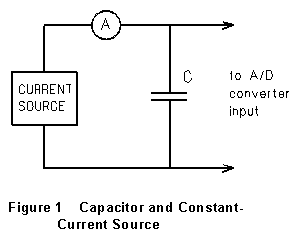
 In the first
part of the experiment, a capacitor is connected to the constant-current
source, with the A/D converter connected across the capacitor as shown.
The A/D converter senses the voltage across the capacitor and converts
it into a digital input to the computer. When the current is switched on,
the computer keeps track of how the capacitor voltage changes in time.
The constant current source is a special kind of a power source. The current from most power sources would drop off as the capacitor charge rises and begins to oppose the flow of more charge. This source "pushes harder" in order to keep approximately 0.001 C of charge flowing onto the plates per second, up to a maximum voltage of about 6 volts, (after which the current begins to decrease).
In order to have the computer plot the capacitor voltage as a function of time: in the program NATIONAL, choose option (5) Set Analog Parameters and then (3) Set Burst Mode Parameters. Then option (1) Number of Data Points in Burst allows you to select the number of data points that you want to plot, and option (2) Set Hi-Frequency Data Rate allows you to select the rate at which you take data (points per second). Thus if you want 1000 data points spread over 20 seconds, you would set 1000 data points in a burst and 50 points per second for the data rate. Then you would exit back to the main menu, choose Take Data, and press any key to start taking capacitor voltage data. (Note that in order to take data for longer than 55 seconds you would have to set the Lo-Frequency Data Rate, since the minimum high frequency rate is 37 per second and the maximum number of points is 2048.)
The electrolytic capacitors used here are "polar," i.e., they must always be charged with the positive charge on the plate marked "+." Since these capacitors recover charge quite slowly after being discharged, the two terminals should be "shorted" (discharged by connecting a conductor between the terminals) just before you start to charge them each time.

(1) Connect the constant current source to capacitor C1 with the A/D converter also connected across the capacitor, as shown in Figure 1. Set the computer parameters to get a 10 second plot of capacitor voltage versus time as the capacitor is charged up, and make a trial run. Then figure out how many seconds will be sufficient to charge the capacitor to roughly 3 volts (2.5-3.5) and adjust the computer parameters accordingly. In order to get an idea of the difference between the way a constant current and the more familiar constant-emf source act, try substituting the latter source for the former and comparing the way that capacitor voltage varies with time. What is the difference? Make drawings in your lab notebook of the voltage vs. time graph in the two cases.
(2) Using the constant current source, make three runs, charging the capacitor to roughly 3 volts each time, and recording the average current supplied by the source during the charging period. For each graph of V vs. t, press key L and use the PgUp and PgDn and arrow keys in order to fit your graph with a straight line. Then press the End key in order to get the equation relating capacitor voltage and time. In one second, how much charge is delivered to the capacitor plates? By how much does the capacitor voltage increase? Calculate the capacitance of capacitor C1, for each of the three trials. Calculate the mean and standard error of your three trials.
(3) Repeat part (2) for capacitor C2.
 (4) Repeat
part (2) for the series combination of C1 and
C2 and compare your measured value with theory. (Remember
to discharge each capacitor by "shorting" it before you
start to charge the series combination.) What is the percentage difference
between the capacitance of the combination as calculated from the individual
capacitances, and the capacitance measured for the combination?
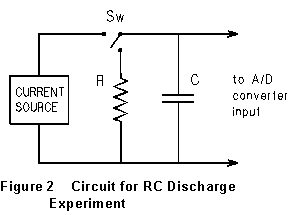
(5) Measure the resistance of your "1000![]() "
resistor with the multimeter. Connect a circuit as shown in Fig. 2. Charge
up capacitor C2 to about 3 volts, and then close the
switch to discharge the capacitor through the 1000
"
resistor with the multimeter. Connect a circuit as shown in Fig. 2. Charge
up capacitor C2 to about 3 volts, and then close the
switch to discharge the capacitor through the 1000 ![]() resistor at the same time that you start the computer recording voltage.
resistor at the same time that you start the computer recording voltage.
(After experimenting with this, choose the duration of data taking so that the voltage drops by at least half while the computer is taking voltage data.) After noting the shape of the V vs. t curve, press the E key (Edit) and then F2 to plot ln V vs. t. Get the slope of this line as you did in the previous parts, and use this slope to calculate capacitance C2.
(6) Set up the computer to observe what happens to the voltage across capacitor C1 during a 400-second interval. Discharge the capacitor, start the computer and again charge the capacitor for enough time to increase its voltage to roughly 3 volts. Then open the current source switch and allow the computer to track the voltage for the remainder of the 400 seconds. Determine the rate at which the capacitor voltage decreases in time after the switch is opened, and use it to calculate the rate at which charge leaks off the capacitor plates. How large is the average leakage current?
This leakage of charge occurs because the dielectric material in the capacitor does not have infinite resistivity, but presents some finite (but large) "leakage resistance" Rint. Record whatever quantities you will need to allow you to estimate Rint.
Suppose that in part (1) the actual current used to charge the capacitor were the measured current minus this leakage current. How would this affect your value of capacitance (if at all)?
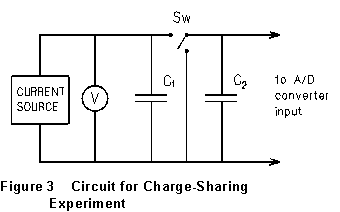
 (7) [OPTIONAL,
or for EXTRA CREDIT: check with your instructor!] Set up a circuit
as shown in Fig. 3. With the computer tracking capacitor voltage as a function
of time, charge capacitor C1 to about 4.0V, stop charging,
and throw switch S to connect C1 to C2.
Note the volt-meter reading just before and just after making this connection.
(1) What happens to the current supplied by a "normal" constant emf source as it charges a capacitor? How does this differ from the behavior of the constant current source?
(2) Finish any calculations mentioned in Procedure sections (2) through (7) that are not already done, and compare with what is expected from the theory.
(3) Is the difference between the capacitance found in part (5) and that found in part (3) large enough to require an explanation? If so, can you think of a plausible reason for the difference?
(4) (If procedure (7) was done) From the voltage measurements of procedure (7) and the capacitance values obtained earlier for C1 and C2, compare your results from this measurement with that expected from the theory.
Capacitance and the RC Circuit
last rev 7/97