Creating an Animated Monkey and Hunter in Excel
Game Plan:
-
We'll have cells for the monkey x and y positions as a function of time
-
The time will be controlled by a scroll bar (or slider) which we'll install
-
The monkey x and y position will be plotted on a graph (as one 'series')
and will move when we run the slider
-
We'll also install cells for the bullet x and y positions as a function
of time
-
We'll add a 'series' for these on the graph
-
Now when we change the time using the scroll bar, both bullet and monkey
will move
First:
-
Put a title 'Monkey and hunter' in cell A1.
-
Save your spreadsheet as Monkey_and_hunter.xls.
-
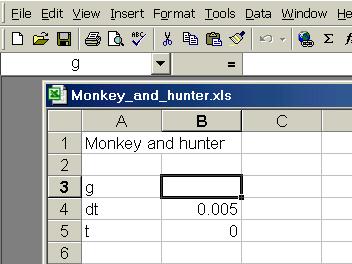
We'll want cells for the gravitational field g, the time increment dt,
and the time t, as shown here

-
In cell A3, type 'g', in cell A4 type 'dt' and in cell A5 type 't'
-
Cell B3 will contain the value of g (which we'll leave as zero for right
now), and we will give it the name 'g'.
-
To 'name' cell B3, click on cell B3 and go to Insert/Name/Define,
and click OK. [This takes the name from what is typed in A3.]
-
B3 is now named 'g'. In the image just above, you can see the 'g' in the
white space at the left below the row of icons.
-
Now name cell B4 as 'dt' and cell B5 as 't'. [Don't put the names in A4
and A5!]
-
In cell B4 type '=0.005', for the value of dt.
-
Next we install the scroll bar.
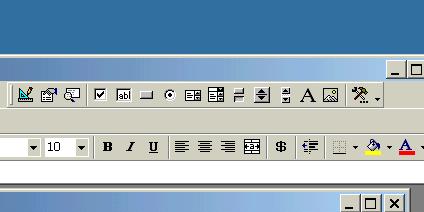
To insert the slider (scroll bar) go to View/Toolbars and
click Control Toolbox.
-
This will bring up a menu probably on your screen but maybe on the top
bar menus which shows a blue draftsman's triangle.
-
You have to click on this triangle to enter 'Design Mode'.
-
Find the scroll bar icon (two triangles separated vertically by a space,
not by a horizontal line).
-
(You don't want the 'spin button' which has a horizontal line separating
the triangles.)
-
Click on the scroll bar icon
-
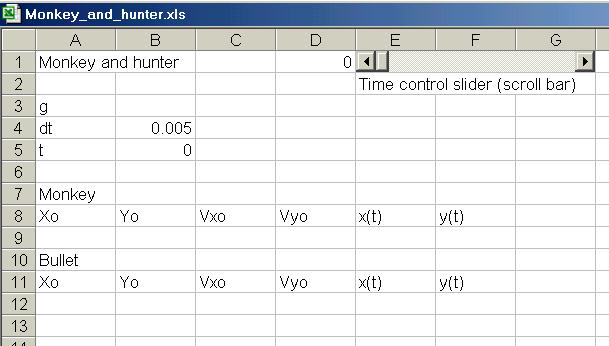
Go to the screen and drag over the area of cells E1 .. G1.
-
Right-click the scroll bar. This will bring up a menu. Click on Properties.
-
The Properties menu contains lots of items
-
set the Linked Cell to D1 [this is just to the
left of the scroll bar itself]
-
set Max to 1000
[this sets the max integer to be 1000]
-
set Large Change to 10 [changes
the value by 10 when you click in the gray area right or left of the button]
-
Click the blue draftsman's triangle to exit 'Design Mode'
-
Try out your slider
-
the little black triangles move the value by 1 (this is the 'Small Change'
on the Properties menu)
-
if you click in the open space on either side of the bar, the value changes
by 10 each time
-
if you hold the mouse button down in these spaces, the change keeps going
-
you can of course drag the bar around with the mouse
-
you should see the integer value in cell D1 changing as you do all this
-
By holding down on the black triangle, you get slow animation, one integer
at a time.
-
By holding the mouse down in the gray area to the right of the bar, you
get a fast animation, increasing 10 at a time.
-
Now connect the scroll bar to the time. In cell B5 type ' =dt*D1'.
-
Now move the slider around and you should see the time changing.
Now for the coordinates of the monkey, and graphing the monkey

-
In cells A8 through F8 type the labels shown in the sketch above, Xo, through
y(t)
-
Select cell A9, then go to Insert/Name/Define and click OK.
-
This names A9 as Xo. Do the same for cells B9, C9, and D9. [We don't need
names for x(t) and y(t) ]
-
Set the values in a A9..D9 to Xo = 5, Yo = 4, Vxo=0,
and Vyo=0. [ In A9 type '=5', etc.]
-
In E9 type '=Xo+Vxo*t', and in F9 type '=Yo + Vyo*t+g/2*t^2'
-
Now test things out by using the slider to increase the time.
-
Nothing should happen since g=0, so change it to g = -10 and try again.
-
After the monkey coordinates seem to be working, you are ready to graph
the monkey.
Graphing the monkey
-
Select cells E5 and F5 then click on the Chart Wizard icon (the one with
colored vertical bars)

-
Select the X-Y scatter graph, then click Finish.
-
The graph which is comes up is not quite what we want, so we fix it up.
-
Put the mouse on a data point on the graph and right-click.
-
On the little menu which comes up, select Source Data, then on the
next menu, select Series.
-
Where it says X-Values, click at the far right where you see a little
red 'x'.
-
This brings up a skinny little menu for X-values.
-
Now click on the cell with the monkey's x-value (cell E5) then click the
red 'x' in the skinny menu
-
Now put the monkey's y-value in by going to Y-Values and clicking
on the little 'x'.
-
Select the monkey y-value and click the skinny menu for Y-values.
-
Now you have the monkey ready to plot but one more thing must be done so
the graph won't look goofy when you graph.
-
Put the mouse on one of the numerical values ( like 4, or 5) of the graph's
y-axis, and right-click.
-

-
This brings up a menu, where you will want to select Scale
-
Here you enter a minimum value of 0, and a maximum value of 6.
-
This prevents the vertical scale from being automatically reset during
animation, and making the graph jumpy.
Now try out the graph of the monkey, animating it using the slider.
You should see the monkey falling as the time increases, eventually disappearing
below the x-axis.
Now for the bullet.
-
Name the cells for the bullet (A12 .. D12).
-
Select cell A12, and go to Insert/Name/Define. Then type
'Xob'. This names that cell.
-
For cells B12..D12, name them Yob, Voxb, and Voyb.
-
For values, insert Xob = 0, Yob=0, Voxb = 5, Voyb=4 in cells A12..D12.
-
Then in cell E12 type '=Xob+Voxb*t'.
-
In cell F12 type '=Yob+Voyb*t+g/2*t^2'
-
Now run the slider and see if the bullet behaves ok when the time is increased
-
Last, right-click on the monkey in the graph, and select Source Data,
then Series
-
Click Add to add a series, then, as you did for the monkey, add
the x and y coordinates of the bullet to the graph.
-
Before running the graph, select a numerical value on the x-axis of the
graph and right-click it
-
Select Scale and set it for a minimum of 0 and a maximum of 6.
-
Now you can run the graph with the slider, and it should behave properly
You will notice that the bullet doesn't hit the monkey, and that the bullet
hits the ground even before reaching the monkey.
These are problems you may want to let your students solve for themselves.
You may want to start them off with g=0, and then they will see the bullet
miss the monkey in any case. They must fix the problem of missing the monkey.
They should be able to predict with some discussion whether the bullet
will hit the monkey when gravity is turned on.


